 Course description
Welcome to the Python for Data Analysis course! In this course, we will explore how Python can be used as a powerful tool for data analysis and manipulation. Whether you're new to Python or already have some programming experience, this course will provide you with the essential knowledge and skills to effectively work with data using Python. Data analysis is a crucial component of various fields, including business, finance, healthcare, and scientific research. Python, with its rich ecosystem of libraries and tools, has become one of the most popular programming languages for data analysis. It offers a wide range of libraries such as NumPy, pandas, and Matplotlib, which provide efficient data structures, data manipulation capabilities, and powerful visualization options. Throughout this course, we will cover fundamental concepts and techniques used in data analysis, including
-
We will start by familiarizing ourselves with the Python programming language, its syntax, and basic data types. We'll also explore how to install Python and set up the development environment.
-
pandas is a powerful library for data manipulation and analysis. We will learn how to load, clean, transform, and merge datasets using pandas' data structures such as Series and DataFrame. We'll cover techniques for indexing, filtering, and handling missing data.
-
We will dive into exploratory data analysis techniques, which involve summarizing and visualizing data to gain insights. We'll explore various statistical measures, create visualizations using Matplotlib and Seaborn, and learn how to customize plots to effectively communicate information.
-
We'll work with real-world datasets to apply the concepts and techniques learned. We'll learn how to read data from different file formats (CSV, Excel, JSON, Image, Video, Audio, etc.) and perform data cleaning, transformation, and aggregation tasks.
-
Effective data visualization is crucial for communicating insights and findings. We'll explore advanced visualization techniques using libraries like Matplotlib, Seaborn, and Plotly, and learn how to create interactive visualizations to enhance data exploration.
-
We'll touch upon the basics of machine learning and explore how to apply simple machine learning algorithms using scikit-learn, a popular machine learning library in Python.
-
By the end of this course, you will have a solid foundation in Python for data analysis, AI and ML Techniques and be equipped with the necessary skills to work with real-world datasets, perform exploratory data analysis, and create meaningful visualizations. So, let's dive into the exciting world of Python for data analysis and get started with the first lesson!
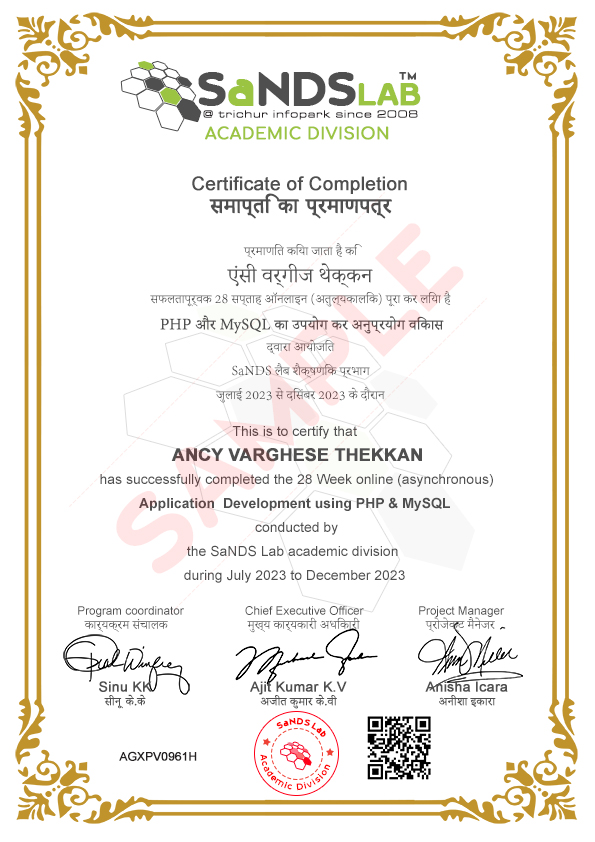
The content of the certificate may vary depends upon the course completed.
5.0
3 ReviewsThe Python course was excellent! The material was clear, and the instructor explained complex concepts in an easy-to-understand manner. I feel much more confident in my Python skills now. Highly recommended!
The Python course was excellent! The material was clear, and the instructor explained complex concepts in an easy-to-understand manner. I feel much more confident in my Python skills now. Highly recommended!
The Python course was excellent! The material was clear, and the instructor explained complex concepts in an easy-to-understand manner. I feel much more confident in my Python skills now. Highly recommended!
